
Class 11 – Economics Sample Paper – 01 (2022-23)
Maximum Marks: 80
Time Allowed: : 3 hours
General Instructions:
- This question paper contains two sections:
Section A – Macro Economics
Section B – Indian Economic Development - This paper contains 20 Multiple Choice Questions type questions of 1 mark each.
- This paper contains 4 Short Answer Questions type questions of 3 marks each to be answered in 60 to 80 words.
- This paper contains 6 Short Answer Questions type questions of 4 marks each to be answered in 80 to 100 words.
- This paper contains 4 Long Answer Questions type questions of 6 marks each to be answered in 100 to 150 words.
Class 11 Economics Sample Paper Section A
- ________ is the root of all economic problems.a) Abundanceb) Allocationc) Wantsd) Scarcity
- Sampling scheme where the units constituting the sample are selected at regular interval after selecting the very first unit at random with equal chance is calleda) Cluster samplingb) Stratified samplingc) Systematic random samplingd) Purposive sampling
- Suppose the correlation coefficient between heights (as measured in feet) versus weight (as measured in pounds) is 0.40. What is the correlation coefficient of height measured in inches versus weight measured in ounces? [12 inches = one foot; 16 ounces = one pound]a) 0.533b) 0.40c) 0.30d) cannot be determined from information given
- Continuous variable assumes _________a) Increase in jumpsb) Both A range of values and Increase in jumpsc) None of thesed) A range of values
To practice more questions & prepare well for exams, download myCBSEguide App. It provides complete study material for CBSE, NCERT, JEE (main), NEET-UG and NDA exams. Teachers can use Examin8 App to create similar papers with their own name and logo.
- ____ is the benchmark index for the Indian stock market.a) Price indexb) Agricultural indexc) Sensexd) None of these
OR
________ in which current year quantities are used
a) Fisher’sb) Laspeyre’sc) Paasche’sd) None of these - A person who actually collect the desired information is called _______.a) Respondentsb) populationc) Investigatord) Enumerator
OR
One of the drawbacks of the Direct personal investigation method is ______.
a) It is very costly and time taking processb) Lacks reliabilityc) Questions might be misinterpretedd) Difficult to get original data - Which of the following statement can be called Statistics?a) Technology of Japan is very advanced.b) In our school there are 5000 students.c) India has per capita income of Rs. 20,000 p.a.d) USA is the richest country in the world.
- Calculate the correlation coefficient of the marks obtained by 12 students in mathematics and statistics and interpret it
Marks (in Maths) 50 54 56 59 60 62 61 65 67 71 71 74 Marks (in statistics) 22 25 34 28 26 30 32 30 28 34 36 40 a) 0.76b) 0.78c) 0.77d) +0.75 - Assertion (A): Prepaid postage stamps should be affixed.
Reason (R): Informants should be required to spend for posting the questionnaires back.a) Both A and R are true and R is the correct explanation of A.b) Both A and R are true but R is not the correct explanation of A.c) A is true but R is false.d) A is false but R is true. - Assertion (A): Special purpose tables are small in size and design to highlight a particular set of facts in simple and analytical forms.
Reason (R): Special purpose tables are made to provide the results of the analysis in an ineffective way so that one finds it easy to make comparisons and clear relationships.a) Both A and R are true and R is the correct explanation of A.b) Both A and R are true but R is not the correct explanation of A.c) A is true but R is false.d) A is false but R is true. - Simple average of price relative method of computing index number suffers from certain limitations. Enumerate those limitations.
- Calculate mode from the following data.
Marks 0-10 10-20 20-30 30-40 40-50 50-60 Number of Students 4 10 20 35 15 6 OR
Find out the median of the data given below by arranging them in ascending order
X 160 150 152 161 156 Frequency 5 8 6 3 7 - The marks obtained by 25 students in a class are as follows:
22, 28, 30, 32, 35, 37, 40, 41, 43, 44, 45, 45, 48, 49, 52, 53, 54, 56, 56, 58, 60, 62, 65, 68, 69- Arrange the above data in the form of a frequency distribution taking class interval. 20-29, 30-39, 40-49, 50-59, 60-69
- Form the less than cumulative frequency distribution also.
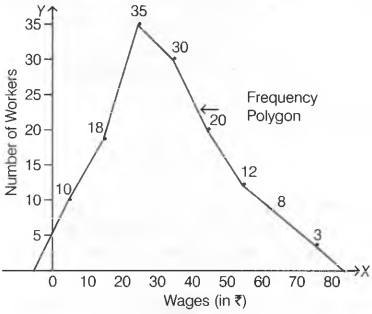
- Construct a frequency polygon without using histogram for the following data.
Wages (in Rs.) Number of Workers 0-10 10 10-20 18 20-30 35 30-40 30 40-50 20 50-60 12 60-70 8 70-80 3 OR
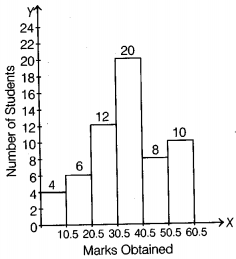
Construct a histogram for the following frequency distribution.
Marks Obtained Number of Students 1-10 4 11-20 6 21-30 12 31-40 20 41-50 8 51-60 10 - Write any three uses of index number especially in economics.
- Calculate the weighted average of price relative index for 2016 on the basis of 2012 from the following data.
Commodity W p0 p1 2012 2016 A 10 15 20 B 8 10 12 C 6 5 8 D 6 10 13 E 4 4 5 - Calculate the correlation coefficient between the height of fathers in inches (X) and their sons (Y).
X 65 66 57 67 68 69 70 72 Y 67 56 65 68 72 72 69 71 - Determine the missing frequencies when mode = 36 and total frequency is 30.
Class Interval 10-20 20-30 30-40 40-50 50-60 Frequency (f) – 5 12 – 2 OR
Calculate arithmetic mean from the following data using step deviation method.
Size 20-29 30-39 40-49 50-59 60-69 Frequency 10 8 6 4 2 Class 11 Economics Sample Paper Section B
- Which of the following statements is correct?a) Stock and supply are always equal.b) Stock refers to the quantity which comes to market for sale.c) Supply does not depend on government’s tax policy.d) There is difference between supply and stock.
- A point outside the PPF indicates:a) Fuller utilization of resourcesb) Unattainable combinationc) Attainable combinationd) Under utilization of resources
OR
Which of the following illustrates a decrease in the unemployment using the PPC ?
a) A movement from a point inside the PPC to a point towards the PPCb) A movement from a point on the PPC to a point inside the PPCc) A movement down along the PPCd) A rightward shift of the PPC - When a firm’s TRTC, it can still cover its normal profita) TRUEb) None of thesec) Can’t sayd) False
OR
In case of perfect competition:
- a firm is able to charge higher price
- a firm is able to charge uniform price
- a firm is able to sell any amount at the prevailing price
a) only ib) Both ii and iiic) only iid) only ii - Which of the following statement is true?
- Average Revenue and Marginal Revenue curves have a positive slope.
- MR curve lies above AR curve. (AR > MR)
- Marginal Revenue falls twice the rate of Average Revenue.
- So long as Marginal Revenue decreases and is negative, Total Revenue increases at a diminishing rate.
a) only iiib) only ic) only ivd) only ii - Money costs meana) Money expenditure of a producer in the production processb) Money expenditure on purchase of goods from the factoryc) Money spent by the consumersd) Money expenditure on output
- The substitute goods of a normal good are those that can be useda) Does not existb) Along with each otherc) In place of each otherd) Together
- What happens to total revenue when Marginal revenue is zeroa) TR risesb) TR fallsc) TR is maximum and constantd) TR is also zero
- Can the AC be less than the MC when AC is fallinga) None of theseb) Can’t sayc) Nod) Yes
OR
Total cost is the vertical summation of:
a) TFC and TVCb) AFC and AVCc) none of thesed) AFC and AVC - Assertion (A): Total expenditure goes in the same direction as the price does.
Reason (R): With rising in the price of a commodity total expenditure decreases and with a fall in its price total expenditure increases.a) Both A and R are true and R is the correct explanation of A.b) Both A and R are true but R is not the correct explanation of A.c) A is true but R is false.d) A is false but R is true. - Assertion (A): Each point on the indifference curve shows one combination of two commodities.
Reason (R): Each combination offers the same level of satisfaction to the consumer.a) Both A and R are true and R is the correct explanation of A.b) Both A and R are true but R is not the correct explanation of A.c) A is true but R is false.d) A is false but R is true. - Define marginal opportunity cost along with a PPC.
- Explain any two factors that affect Price Elasticity of Demand.
OR
Price Elasticity of Demand of a good is (-) 0.75. Calculate the percentage fall in its price that will result in 15% rise in its demand.
- A and B are complementary goods. Explain the effects of change in price of A on demand for B.
- From the following schedule, find out the level of output at which the producer is in equilibrium. Give reasons for your answer.
Output (Units) 1 2 3 4 5 6 7 Price (Rs.) 24 24 24 24 24 24 24 Total Cost 26 50 72 92 115 139 165 OR
From the following Total Cost and Total Revenue schedule of a firm, find out the level of output, using Marginal Cost and Marginal Revenue approach, at which the firm would be in equilibrium. Give reasons for your answer.
Output (units) Total Revenue (Rs) Total Cost (Rs) 1 10 9 2 18 15 3 24 21 4 28 25 5 30 33 To practice more questions & prepare well for exams, download myCBSEguide App. It provides complete study material for CBSE, NCERT, JEE (main), NEET-UG and NDA exams. Teachers can use Examin8 App to create similar papers with their own name and logo.
- Define a budget line. When can it shift to the right?
- Calculate the MP of variable factor and indicate the various phases of Law of Variable Proportions from the following schedule:
Units of variable factor 0 1 2 3 4 5 6 TP (in units) 0 50 110 150 180 180 150 - Suppose the demand and supply curves of salt are given by:
qD = 1,000 – p
qS = 700 + 2p- Find the equilibrium price and quantity.
- Now suppose that the price of an input used to produce salt has increased so that the new supply curve is qs = 400 + 2p
How do the equilibrium price and quantity change? Does the change confirm to your expectation? - Suppose the government has imposed a tax of Rs 3 per unit of sale of salt.
How does it affect the equilibrium price and quantity?
OR
Explain the outcome of the following features of a perfectly competitive market.
- Freedom to the firms to enter the industry.
- Freedom to the firms to leave the industry.
Class 11 – Economics Sample Paper – 01 (Solution)
Solution
Class 11 Economics Model Paper Section A
- (d) Scarcity
Explanation: Had all resources in infinite abundance, the problems: what to produce, for whom to produce and how to produce wouldn’t have taken place. - (c) Systematic random sampling
Explanation: If a researcher wanted to create a systematic sample of 1,000 students at a university with an enrolled population of 10,000, he or she would choose every tenth person from a list of all students. - (b) 0.40
Explanation: The formula for calculating the correlation coefficient standardizes the variables, changes in scale or units of measurement will not affect its value. - (d) A range of values
Explanation: If a variable can take on any value between its minimum value and its maximum value, it is called a continuous variable. - (c) Sensex
Explanation: Sensex is the short form of Bombay Stock Exchange Sensitive Index with 1978–79 as base. The value of the sensex is with reference to this period. It is the benchmark index for the Indian stock market. It consists of 30 stocks which represent 13 sectors of the economy and the companies listed are leaders in their respective industries.OR
(c) Paasche’s
Explanation: Passche’s Price Index is calculated by taking current year quantities as base therfore it is also called current year quantity weight method.
To practice more questions & prepare well for exams, download myCBSEguide App. It provides complete study material for CBSE, NCERT, JEE (main), NEET-UG and NDA exams. Teachers can use Examin8 App to create similar papers with their own name and logo. - (d) Enumerator
Explanation: An enumerator is the person who collects data on the behalf of an investigator(an individual or an organisation).OR
(a) It is very costly and time taking process
Explanation: Here, the investigator himself visits the persons those are source of the data and collects necessary information either through interview with the persons concerned or through observation of the data on the spot due to which this method is costly as well as time taking. - (c) India has per capita income of Rs. 20,000 p.a.
Explanation: We can infer much about national income , income distribution and economic growth, given per capita income.In case of other three options nothing can be interpreted. - (b) 0.78
Explanation:X Y 50 22 -12 -8 144 64 96 54 25 -8 -5 64 25 40 56 34 -6 4 36 16 -24 59 28 -3 -2 9 4 6 60 26 -2 -4 4 16 8 62 (A) 30 (A) 0 0 0 0 0 61 32 -1 2 1 4 -2 65 30 3 0 9 0 0 67 28 5 -2 25 4 -10 71 34 9 4 81 16 36 71 36 9 6 81 36 54 74 40 12 10 144 100 120 ∑ 6 5 598 285 324 r =
= = 0.78 - (c) A is true but R is false.
Explanation: Prepaid postage stamps should be affixed because informants should not be required to spend for posting the questionnaires back. - (c) A is true but R is false.
Explanation: Special purpose tables are small in size and design to highlight a particular set of facts in simple and analytical forms. Special purpose tables are made to provide the results of the analysis in an effective way so that one finds it easy to make comparisons and clear relationships. - This method is not affected by change in the units of measurement or by extreme values. However, it suffers from the following limitations
- This method also gives equal weights to all the items and thus ignores their relative importance in the group. However, in actual practice, a few price relatives are more important than others.
- In this method, difficulty is faced with regard to the selection of an appropriate average. This method uses arithmetic mean for computing average, which is not suitable for study of index numbers.
- By observation, the modal class is 30-40, since it has maximum frequency 35.
Now, l1=30, f1=35, f2=15, f0=20, and c=10
where is the lower limit of the modal class is the frequency of the modal class is the frequency of the class preceding the modal class, is the frequency of the class succeeding the modal class and i is the class interval of the modal class.
Mode,
Mode (M0)=34.3 marksOR
The given series is a discrete series. So after arranging the data in ascending order, we have to find the cumulative frequency i.e. c multiplied by f.
Calculation of MedianX Frequency (f) Cumulative Frequency (cf) 150 8 8 152 6 14 156 7 21 160 5 26 161 3 29
=Size of 15th item
Since 15 is greater than 14 and less than 21, so, the 15th item lies in cf 21, and the value corresponding to this cumulative frequency is 156.
Hence Median =156 - Given the data in individual series, we first convert given data into frequency distribution using tally marks. Now, less than cumulative frequency is obtained by adding successively the frequencies of all the previous classes including the class against which it is written. The cumulate is started from the lowest to the highest size.
- The frequency distribution of given data is shown below
Class Interval Tally Bar Frequency (f) 20-29 || 2 30-39 |||| 4 40-49  |||
|||8 50-59 |6 60-69 5 Total 25 - (a)To form cumulative frequency distribution (less than) of the given distribution, the exclusive group will be formed.
Class Interval Exclusive Group Frequency (f) 20-29 19.5-29.5 2 30-39 29.5-39.5 4 40-49 39.5-49.5 8 50-59 49.5-59.5 6 60-69 59.5-69.5 5 Total 25 (b). Cumulative frequency distribution (less than) is given below:
Class Interval Frequency Cumulative frequency (cf) Less than 29.5 2 2 Less than 39.5 4 4+2=6 Less than 49.5 8 8+6=14 Less than 59.5 6 14+6=20 Less than 69.5 5 20+5=25
- The frequency distribution of given data is shown below
OR
First of all, we have convert the given class intervals into exclusive class intervals. The steps for this conversion is given below:
Step 1. First of all, the difference between the lower class limit of the second class and the upper class limit of the first class is computed, i.e.,11 – 10 = 1.
Step 2. Then this difference is divided by 2, i.e.,
Step 3. Then 0.5 is subtracted from the lower class limit and added to the upper class limit of each class to form an exclusive distribution.
The distribution will now take the following form:-Marks Obtained Number of Students 0.5-10.5 4 10.5-20.5 6 20.5-30.5 12 30.5-40.5 20 40.5-50.5 8 50.5-60.5 10 Step 4. The distribution is represented by the given histogram. On the X axis we show marks obtained and on the Y axis number of students are shown.
- (i) Uses of index number are
- Index numbers are helpful in measuring the purchasing power i.e., value of the money: The value of money depends on its purchasing power and purchasing power of money depends on the price of commodities. The change in price adversely affects the value of money.
- These numbers are used to measure level of economic activities like import, export, production, population, etc.
- These numbers are helpful in evaluating economic policy e.g., index number helps in knowing the effect of export policy on export.
- Index numbers act as economic barometers. They measure the pulse of an economy and act as a barometer to indicate fluctuations in general economic conditions of a country.
(ii)
Construction of Weighted Index Number
Here, we consider price relative as variable and multiply each value of the variable with the corresponding weight and dividing the sum by the sum of weights.
Commodity W Price in (Rs.) (p0) 2012 Price in (Rs.) (p1) 2016 IW A 10 15 20 133.33 1333 B 8 10 12 120.00 960 C 6 5 8 160.00 960 D 6 10 13 130.00 780 E 4 4 5 125.00 500
Thus, prices have increased by 33.3 percent. - Calculation of Coefficient of Correlation
X x(X – ), = 66.75 x2 Y y(Y – ), = 67.5 y2 xy 65 -1.75 3.0625 67 -0.5 0.25 0.875 66 -0.75 0.5625 56 -11.5 132.25 8.625 57 -9.75 95.0625 65 -2.5 6.25 24.375 67 0.25 0.0625 68 0.5 0.25 0.125 68 1.25 1.5625 72 4.5 20.25 5.625 69 2.25 5.0625 72 4.5 20.25 10.125 70 3.25 10.5625 69 1.5 2.25 4.875 72 5.25 27.5625 71 3.5 12.25 18.375 X = 534 x2 = 143.5 Y = 540 y2 = 194 xy = 73 Here, n = 8, X = 534, x2 = 143.5, Y = 540, y2 = 194, xy = 73
Now, = 66.75, and = 67.5
It indicates that there is low degree of positive correlation between height of fathers and sons. - Let the missing frequencies be x and y.
Class Interval Frequency (f) 10-20 x 20-30 5 30-40 12 40-50 y 50-60 2 n=30 Calculation of Missing Frequencies
Mode = 36 (given) Sum of frequencies= (given) As the value of mode is 36, so the modal class is 30-40.
6(19-y)=70 114-6y=70
6y=44
[as the frequencies cannot be in fractions]x+5+12+y+2=30
x+5+12+7+2=30 [y=7] x=4Thus, the two missing frequencies are 4 and 7.
OR
For the calculation of Arithmetic Mean, let Assumed mean (A) =34.5
Calculation of Arithmetic Mean
Class Interval Frequency (f) Mid-Value (m)
m=(L1+L2)/2d=m-A
A=34.5d’m=dm/c
c=10fd’m 20-29 10 24.5 -10 -1 -10 -10 30-39 8 34.5 0 0 0 40-49 6 44.5 +10 +1 +6 +20 50-59 4 54.5 +20 +2 +8 60-69 2 64.5 +30 +3 +6 Here
A =34.5, , , c = 10
Now,
Therefore, arithmetic mean of the given data is 37.83 Class 11 Economics Model Paper Section B
- (d) There is difference between supply and stock.
Explanation: There is difference between supply and stock. - (b) Unattainable combination
Explanation: The points beyond the PPF curve are unattainable combinations. These points cannot be achieved by existing resources. Thus, any point beyond the PPF curve can be attained by increasing the supply of resources or factor inputs or by technological innovation with respect to both the goods.OR
(b) A movement from a point on the PPC to a point inside the PPC
Explanation: A production possibilities frontier can be used to illustrate how the unemployment or misallocation of resources causes a society to produce fewer goods and services than possible.Points on or inside the PPF are attainable. Production efficiency is achieved when it is impossible to produce more of one good without producing less of some other good; i.e., no resources are being wasted. - (d) False
Explanation: When TR<TC, the firms profit will start declining. The firm can make normal profits when TR=TC or MR=MC.OR
(b) Both ii and iii
Explanation: Perfect competition is a form of the market where there is a large number of buyers and sellers of a commodity. how much genius product is sold and its price is determined by the force of supply and demand. An individual buyer or seller has no control over price. Accordingly, any individual form fails to make any influence on the price of the commodity. - (a) only iii
Explanation: Marginal Revenue falls twice the rate of Average Revenue.MR and AR fall with an increase in output. Because fall in MR is double than that in AR, i.e., MR falls at a rate which is twice the rate of fall in AR. - (a) Money expenditure of a producer in the production process
Explanation: When production cost is expressed in terms of monetary units, it is called money cost. - (c) In place of each other
Explanation: Substitute goods are those goods that can satisfy the same necessity, they can be used for the same end. - (c) TR is maximum and constant
Explanation: When MR is zero, then TR is maximum. and after this level, the MR starts becoming negative and TR starts falling. - (c) No
Explanation: When AC falls then MC will be less than AC. So AC cant be less than MC when AC is falling. This is because when MC curve lies below the AC Curve it pulls the latter downwards.OR
(a) TFC and TVC
Explanation: Vertical summation is vertically adding up the values of TFC and TVC when TC, TVC and TFC are measured on the vertical axis. - (c) A is true but R is false.
Explanation: Total expenditure goes in the same direction as the price does because with a fall in the price of a commodity total expenditure decreases and with a rise in its price total expenditure increases. - (b) Both A and R are true but R is not the correct explanation of A.
Explanation: Each point on the indifference curve shows one combination of two commodities. Each combination offers the same level of satisfaction to the consumer. - The slope of the production possibility curve is marginal opportunity cost or marginal rate of transformation which refers to the additional sacrifice that a firm makes when they shift resources and technology from the production unit of one commodity to the other commodity in an economy. It is the ratio between loss of output and gain of output when some resources are shifted from use 1 to use- 2.
- The two factors that affect Price Elasticity of Demand are:
- Number of substitutes of goods: Demand for goods which have close substitutes (like tea and coffee) is relatively more elastic, because when the price of such a good rise, the consumers have the option of shifting to its substitute. Goods without close substitutes like wheat and salt etc are generally found to be less elastic or inelastic in demand. Thus the availability of close substitutes makes the demand sensitive to change in prices.
- Proportion of income spent on the goods: Goods on which consumers spend a small proportion of their income (toothpaste, needles etc) will have an inelastic demand i.e. when prices of such goods change, consumers continue to purchase the almost same quantity of these goods. On the other hand, goods on which the consumers spend a large proportion of their income (cloth, television etc) tend to have elastic demand. However, if the proportion of income spent on a commodity is large, then demand for such a commodity will be elastic.
OR
Percentage change in price =
i.e. Price falls by 20%- Complementary goods:
- Those goods which are used together for the fulfilment of a demand
- For Example: Car and Petrol.
- Graphical representation:
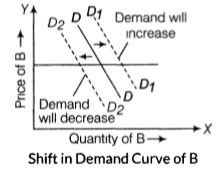
- Change in price of A on demand for B can be studied with respect to the given two conditions:
- Price of A rises If the prince of A rises, then it will result in fall in the demand of A, and therefore demand for B will also fall. As a result, demand curve DD will shift leftwards to D2D2.
- Price of A falls If the price of A falls, then it will result in an increase in the demand of A, and therefore demand for B will also increase. As a result demand curve, DD will shift rightwards to D1D1.
Output (Q) Price(P) TC
(Rs.)TR (Rs.)
TR = Q PProfit (Rs.)
= TR – TC1 24 26 24 -2 2 24 50 48 -2 3 24 72 72 0 4 24 92 96 4 5 24 115 120 5 6 24 139 144 5 7 24 165 168 3 Equilibrium refers to a state of rest when no change is required. A firm (producer) is said to be in equilibrium when it has no inclination to expand or to contract its output. The producer achieves equilibrium at 6 units of output. It is because this level of output satisfies both the conditions of producer’s equilibrium:
- The difference between TR and TC is positively maximised.
- Total profits fall after that level of output.
OR
Total and Marginal Cost and Revenue Schedule
Output (units) Total Revenue (TR) (Rs) Total Cost (TC) (Rs) Marginal Revenue (MR) (Rs) Marginal Cost (MC) (Rs) 1 10 8 10 8 2 18 15 8 7 3 24 21 6 6 4 28 25 4 4 5 30 33 2 8 The firm will be in equilibrium when the output is 4 units.
Reason: The conditions for the producer’s equilibrium are- Marginal Cost = Marginal Revenue
- Beyond the level of output at which marginal cost= marginal revenue, marginal cost must be greater than marginal revenue Both these conditions are satisfied at 4 units of output. So, the producer is in equilibrium when he produces 4 units.if a producer produces 5 unit of output, the producer will get the loss.
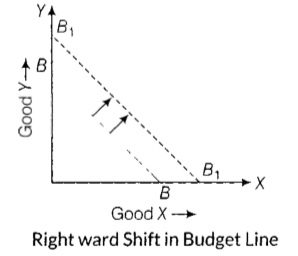
- Budget line is a line showing different combinations of two goods which a consumer can buy or afford, at his given income and market price of the goods. The Budget Line also called as Budget Constraint. Consumer theory uses the concepts of a budget constraint and a preference map to analyze consumer choices. The equation of the budget line is:
Px . Qx + Py . Qy = M,
Where Px = Price of good X
Py = Price of good Y
Qx = Quantity of good X
Qy = Quantity of good Y
M = Money income.
It can shift to the right when the consumer is able to increase the consumption of both the goods. It will be possible due to the following reasons:- When the level of income increases,the consumer will be able to buy more bundle of goods,which were previously not possible.
- When prices of both the goods fall,the consumer can now purchase more goods with the same income level.
- Law of variable proportions occupies an important place in economic theory. This law examines the production function with a one-factor variable, keeping the quantities of other factors fixed. In other words, it refers to the input-output relation when output is increased by varying the quantity of one input.
Variable Factors
(VF)TP (in units)
(TP)MP (in units)
MPn = TPn – TPn-1Stage 0 0 – 1st (Increasing returns to a factor) 1 50 50 2 110 60 3 150 40 2nd (Diminishing returns to a factor) 4 180 30 5 180 0 6 150 -30 3rd (Negative returns to a factor) To practice more questions & prepare well for exams, download myCBSEguide App. It provides complete study material for CBSE, NCERT, JEE (main), NEET-UG and NDA exams. Teachers can use Examin8 App to create similar papers with their own name and logo.
- qD = 100 – p … (1)
qS = 700 + 2p … (2)(a) At equilibrium
Quantity demanded = Quantity supplied
1000 – p = 700 + 2p
300 = 3 p
100 = p
p = Rs 100
qD= 1000 – 100 [Substituting the value of p in equation (1)] = 900 units
So, the equilibrium price is Rs 100 and the equilibrium quantity is 900 units.
(b) New quantity supplied q’s
q’s = 400 + 2p
At equilibrium qd = q’s
1000 – p = 400 + 2p
600 = 3p
200 = p
p = Rs 200
Prior to the increase in the price of input, the equilibrium price was Rs 100, and after the rise in input’s price, the equilibrium price is Rs 200.
So the change in the equilibrium price in Rs 100 (200 – 100).
qD = 4000 – 200 [Subtitling the value of p in equation (1)] = 800 units
The change in the equilibrium quantity is 100 units (i.e. 900 – 800 units).
Yes, this change is obvious, as due to the change in the input’s price, the cost of producing salt has increased and consequently producers will be willing to supply less, that will shift the marginal cost curve leftward and move the supply curve to the left. A leftward shift in the supply curve results in a rise in the equilibrium price and a fall in the equilibrium quantity.
(c) The imposition of a tax of Rs 3 per unit of salt sold will raise the cost of producing salt. Consequently, supply decreases. This will shift the supply curve leftwards and the quantity supplied equation will become
ys = 700 + 2 (p – 3)
At equilibrium
yd = ys
1000 – p = 700 +2 (p – 3)
1000 – p = 700 +2p – 6
306 = 3p
= p
p = Rs 102
Substituting the value of p in equation (1)
yd = 1000 – p
yd = 1000 – 102
yd = 898 units
Thus, the imposition of a tax of Rs 3 per unit of salt sold will result in an increase in the price of salt from Rs 100 to Rs 102. The equilibrium quantity falls from 900 units to 898 units.OR
- Freedom to the firms to enter the industry: In a perfectly competitive market, firms are free to enter the industry. There are no legal or statutory restrictions on the entry of new firms in the market. The outcome of this feature is that all the firms in the industry are able to earn only normal profits in the long run. If, the firms are earning super normal profits (that is, the price is greater than the minimum of LAC) then, it attracts new firms in the market. Consequently, the total output in the industry increases and the price falls. Price continues to fall till it becomes equal to the minimum of the LAC curve and the super-normal profits are wiped out.
- Freedom of the firms to leave the industry: In a perfectly competitive market, firms are free to leave the industry. There are no legal or statutory restrictions to this regard.
The outcome of this feature is that all the firms in the industry are able to earn normal profits in the long-run. If the firms are suffering abnormal losses (that is, the price is less than the minimum of LAC) then, it leads some of the firms to exit the market. Consequently, the total output in the industry falls and the price rises. Price continues to rise till it becomes equal to the minimum of the LAC curve and the abnormal losses are wiped out.


